
Real-Time Logs
Introduction
CDN77 Real-Time Logs provide detailed insights into the interactions between client requests and server responses. They are generated and uploaded in batches every 30s. Once processed, you can access them directly in the Client Panel and a dedicated S3 bucket.
The main purpose is to provide near-immediate visibility into system activities for specific CDN Resource(s). This helps to quickly analyze statistics, detect anomalies and resolve issues before they are escalated into major incidents.
Setup
If Real-Time Logs aren’t accessible to you yet, please contact our team at support@cdn77.com, and we’ll enable them for your account. Once the feature is enabled, log in to the Client Panel, open Traffic Logs in the side navigation, and select Real-Time Logs.
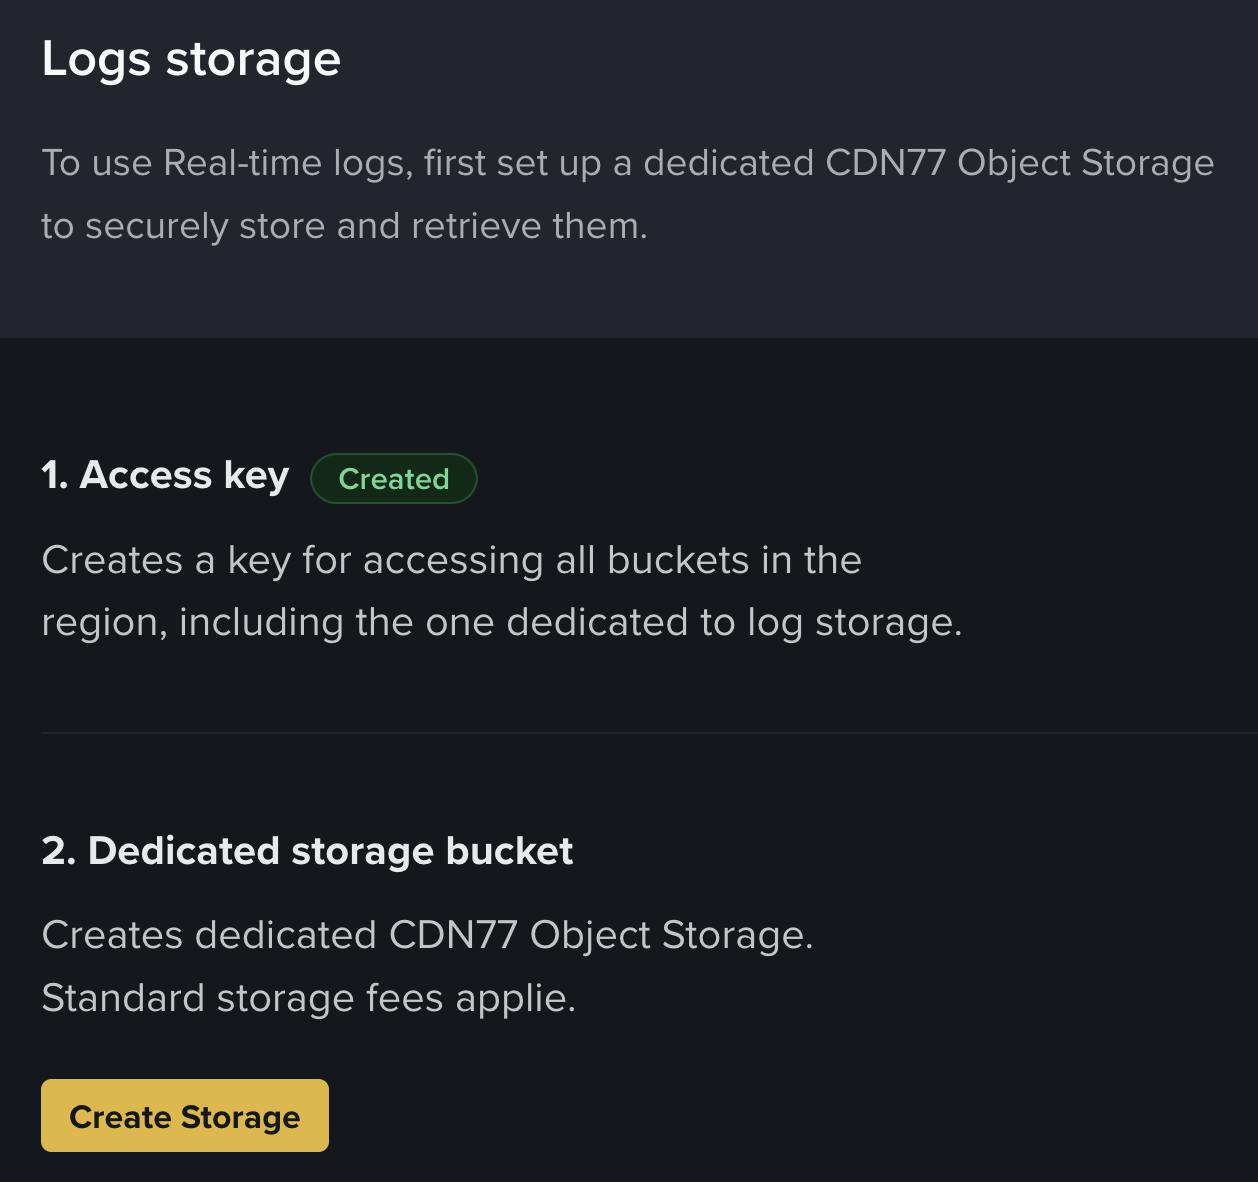
- First, you will be prompted to create a new dedicated object storage for Real-Time Logs.
2. Continue to the Logs configuration setup, where you can define the configuration name, log format, and log retention period (TTL). The retention period defines how long Real-Time Logs are kept. Logs older than the selected period are automatically deleted every day at midnight. Leave the field empty to keep logs indefinitely.
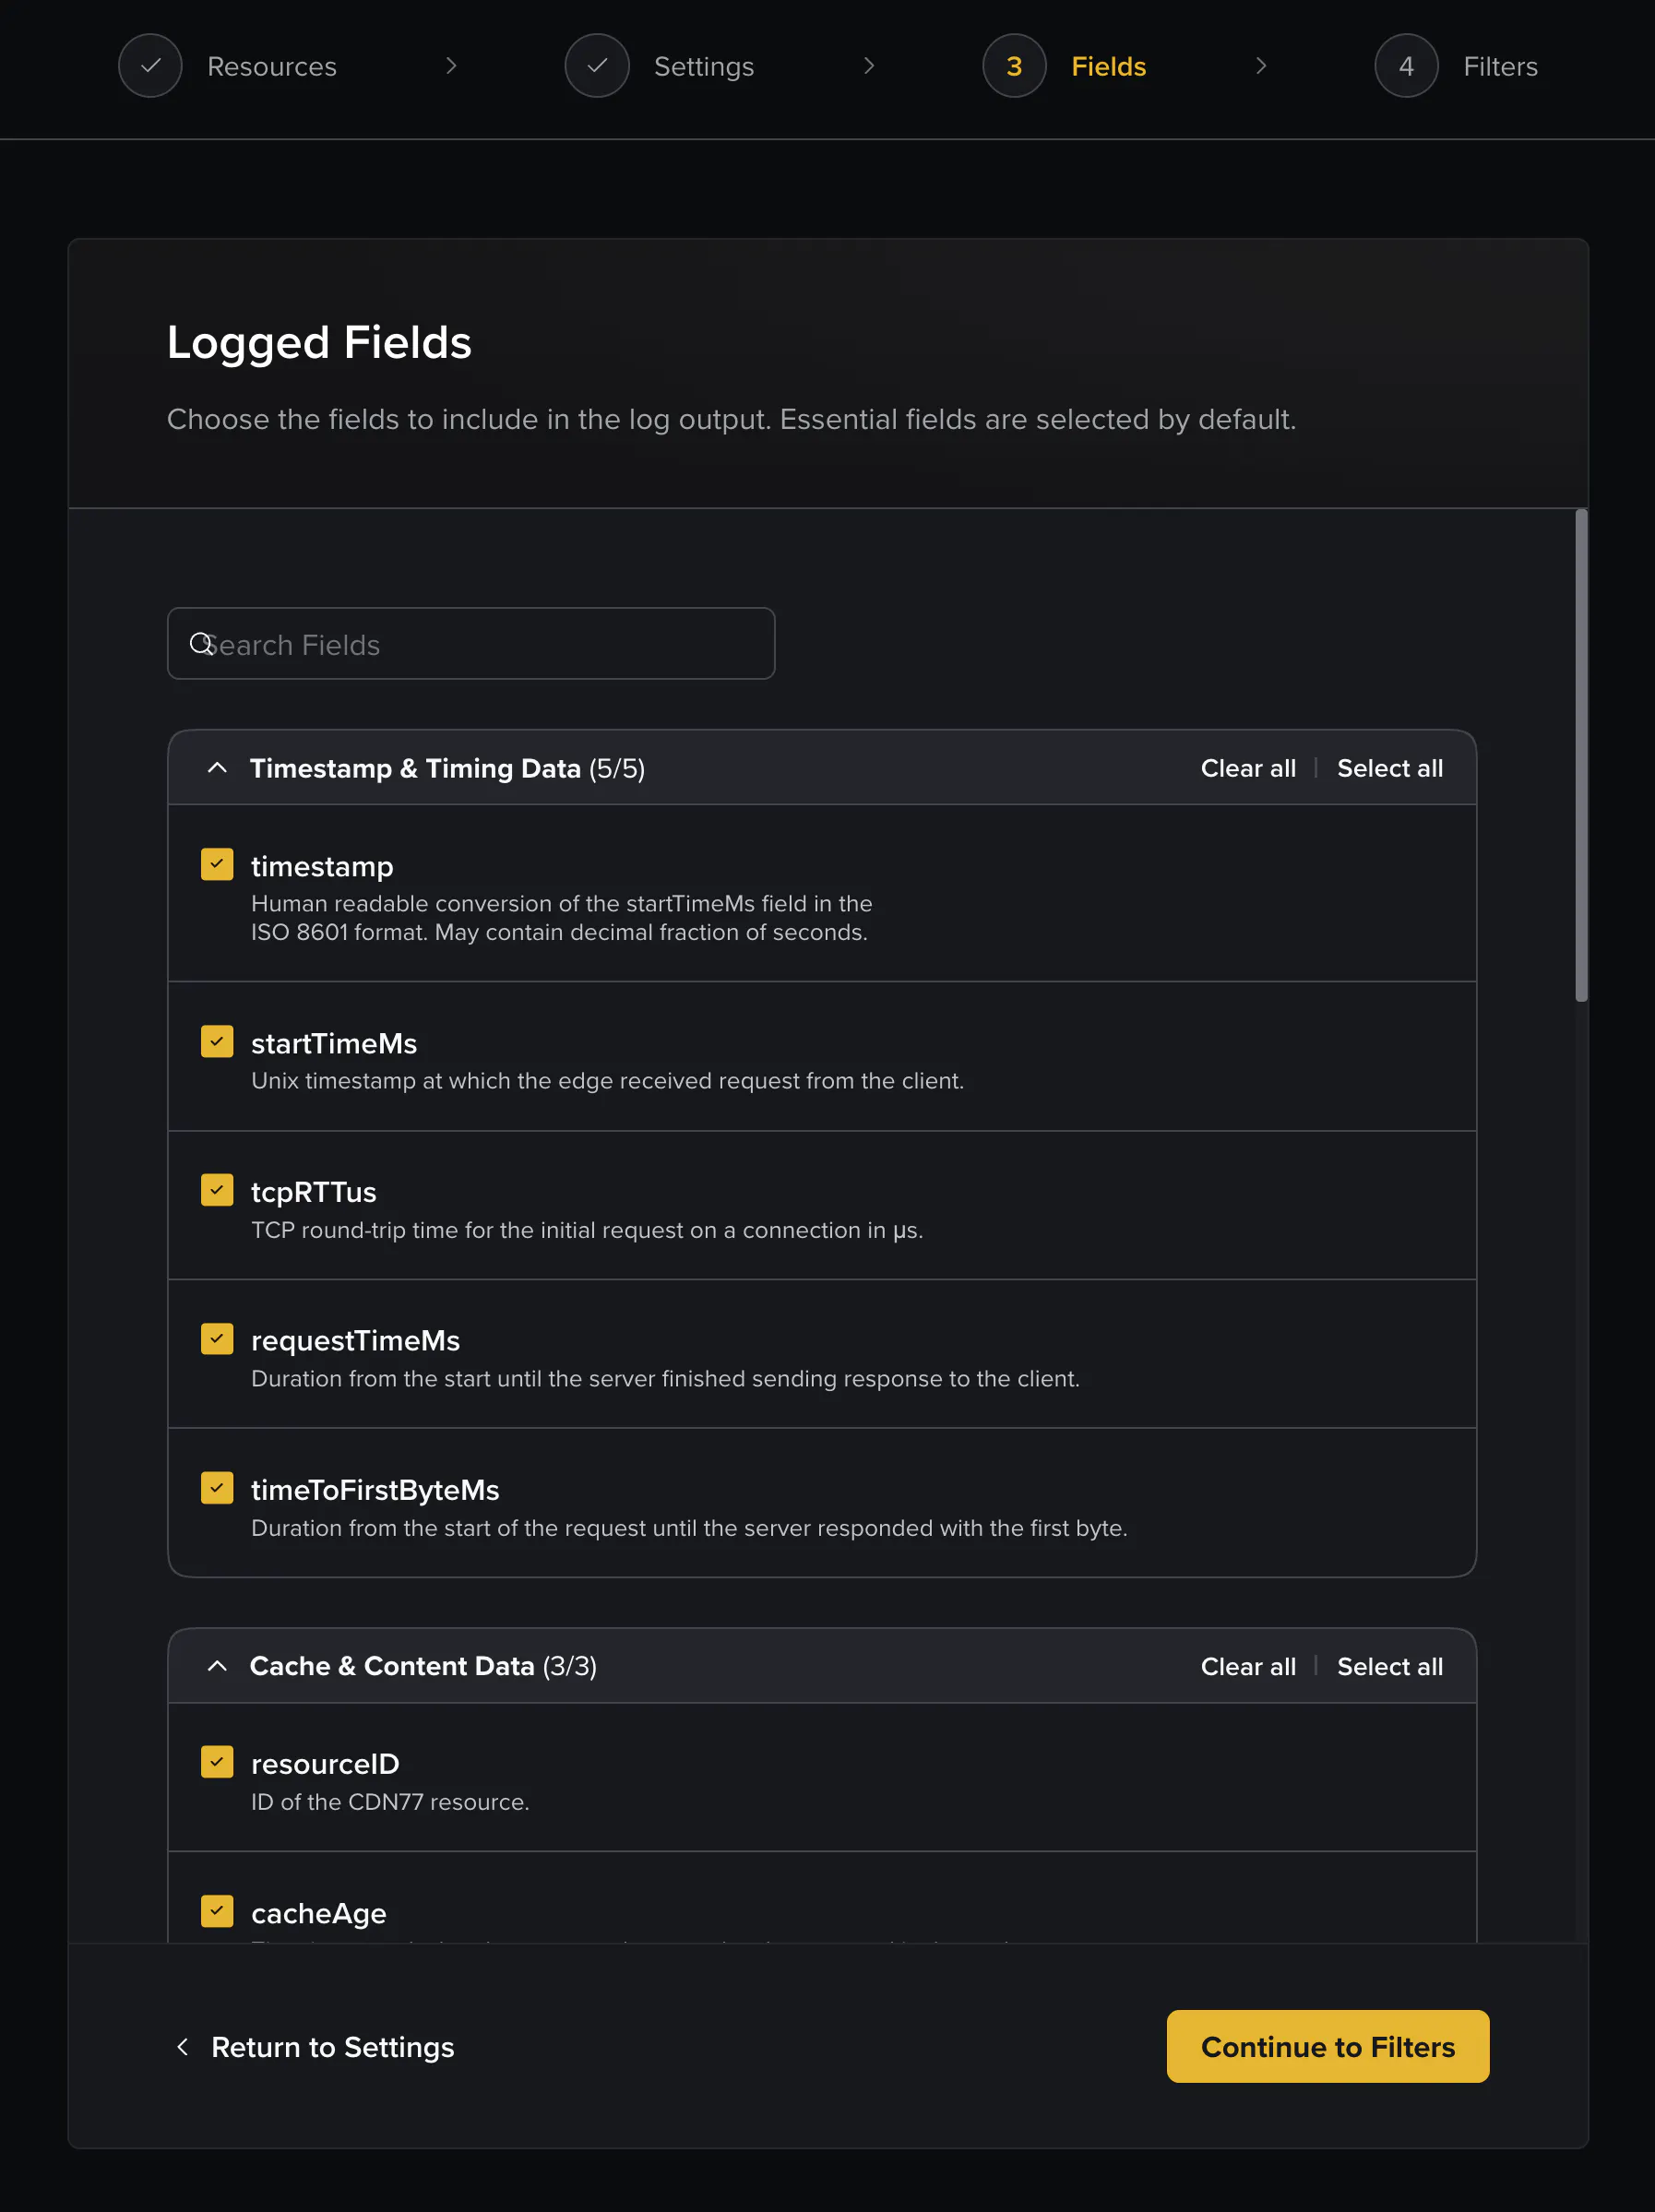
3. Choose the logged fields you want to include in the log output. You can select only the fields that are relevant to your use case. This helps keep your logs focused, easier to analyze, and reduces unnecessary data in the output. Essential fields are selected by default.
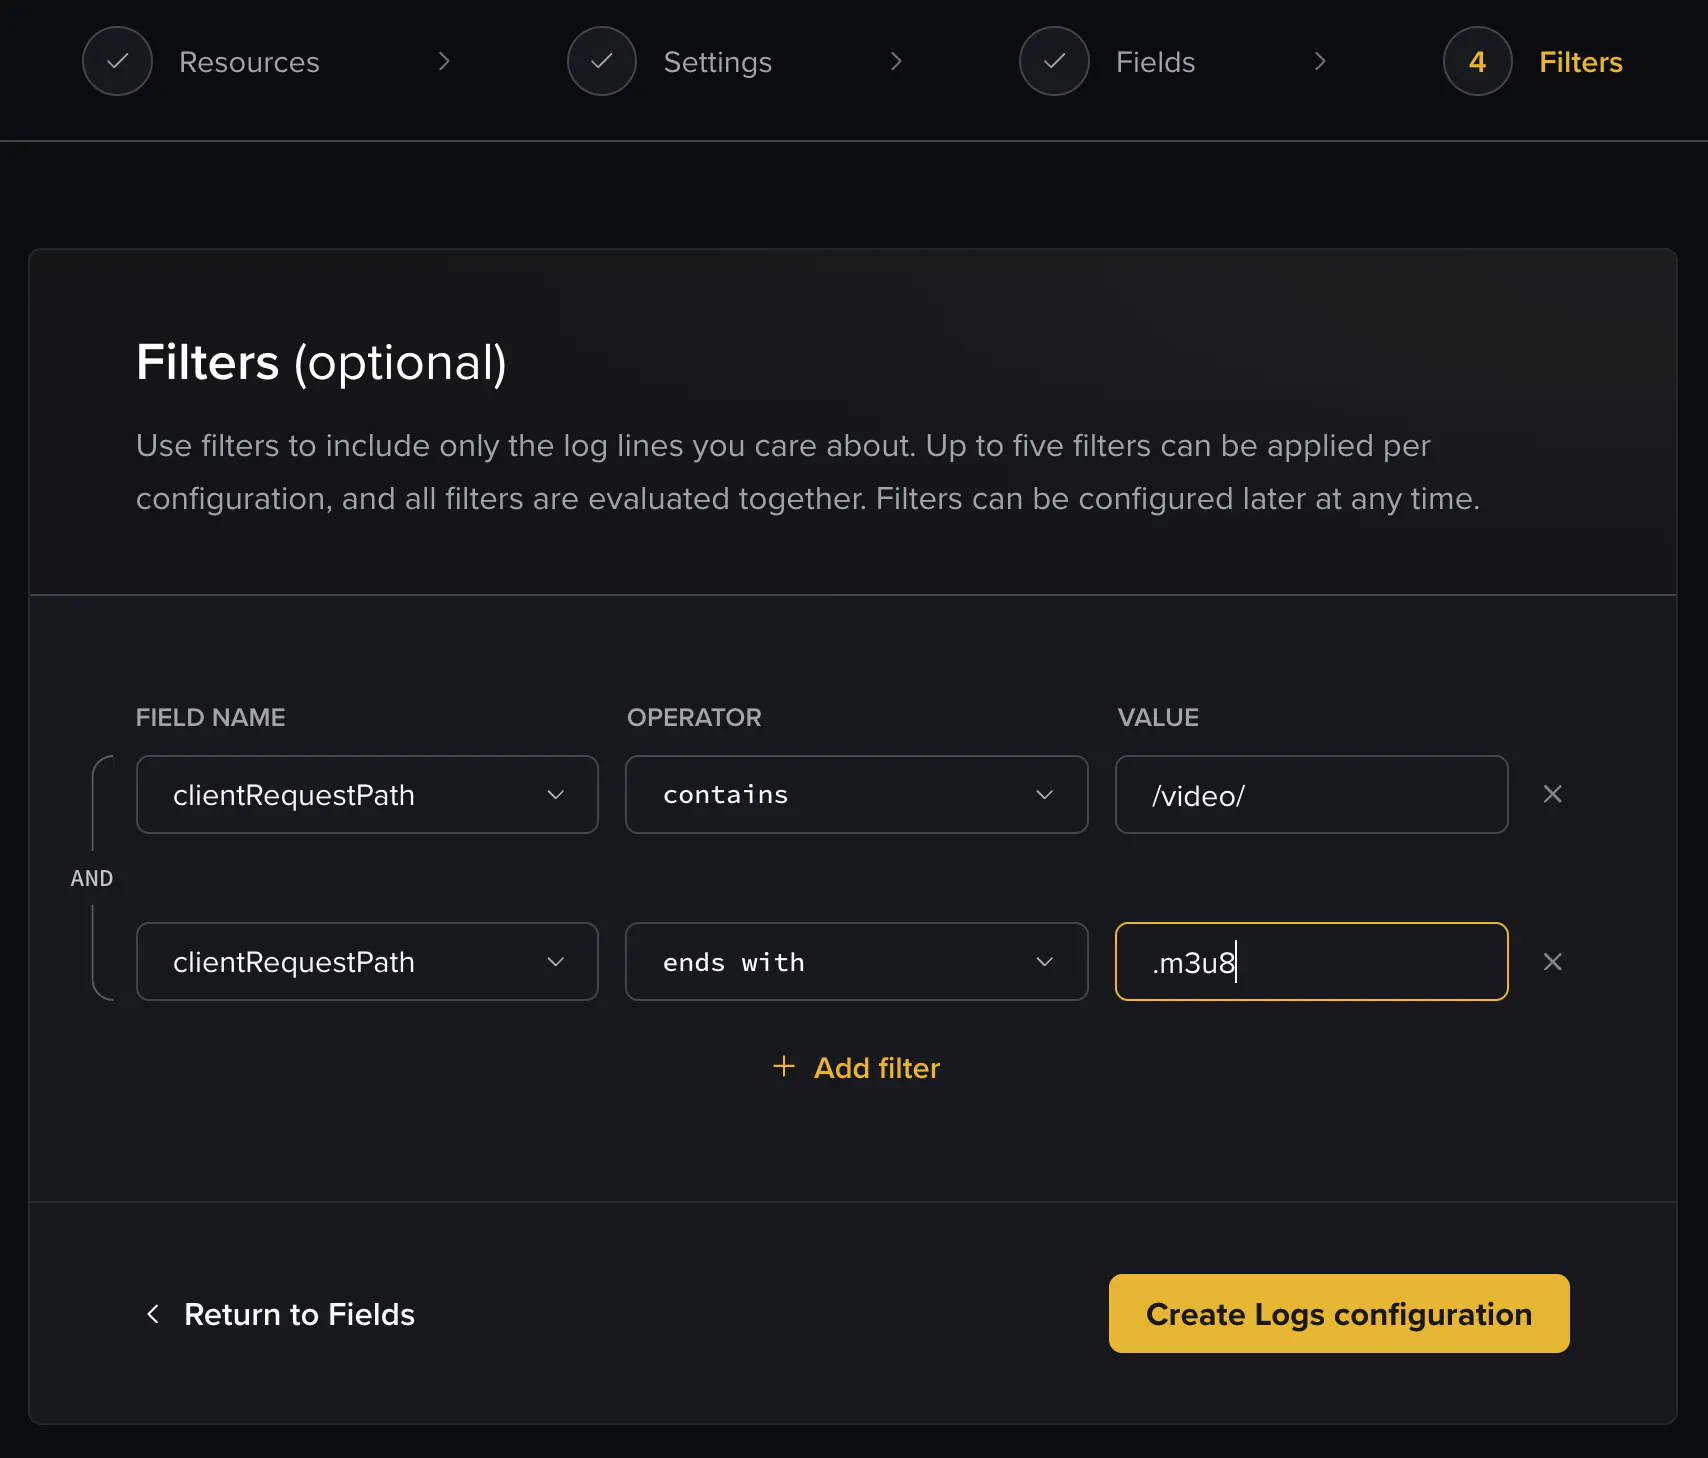
4. Optionally, configure filters for the Real-Time Logs configuration. Filters allow you to include only log lines that match specific conditions. Each filter consists of a field, an operator, and a value. You can apply up to five filters per configuration.
All filters are evaluated together using the AND condition. This means that a log line must match every configured filter to be included in the output. For example, you can configure filters to log only requests where: clientCountry equals "PL"
In this case, only log lines for requests from Poland will be included.
5. Review the configuration and click Create Logs configuration.
6. Once the configuration is created, you’ll receive a confirmation with the bucket and folder location in the dedicated CDN77 Object Storage.
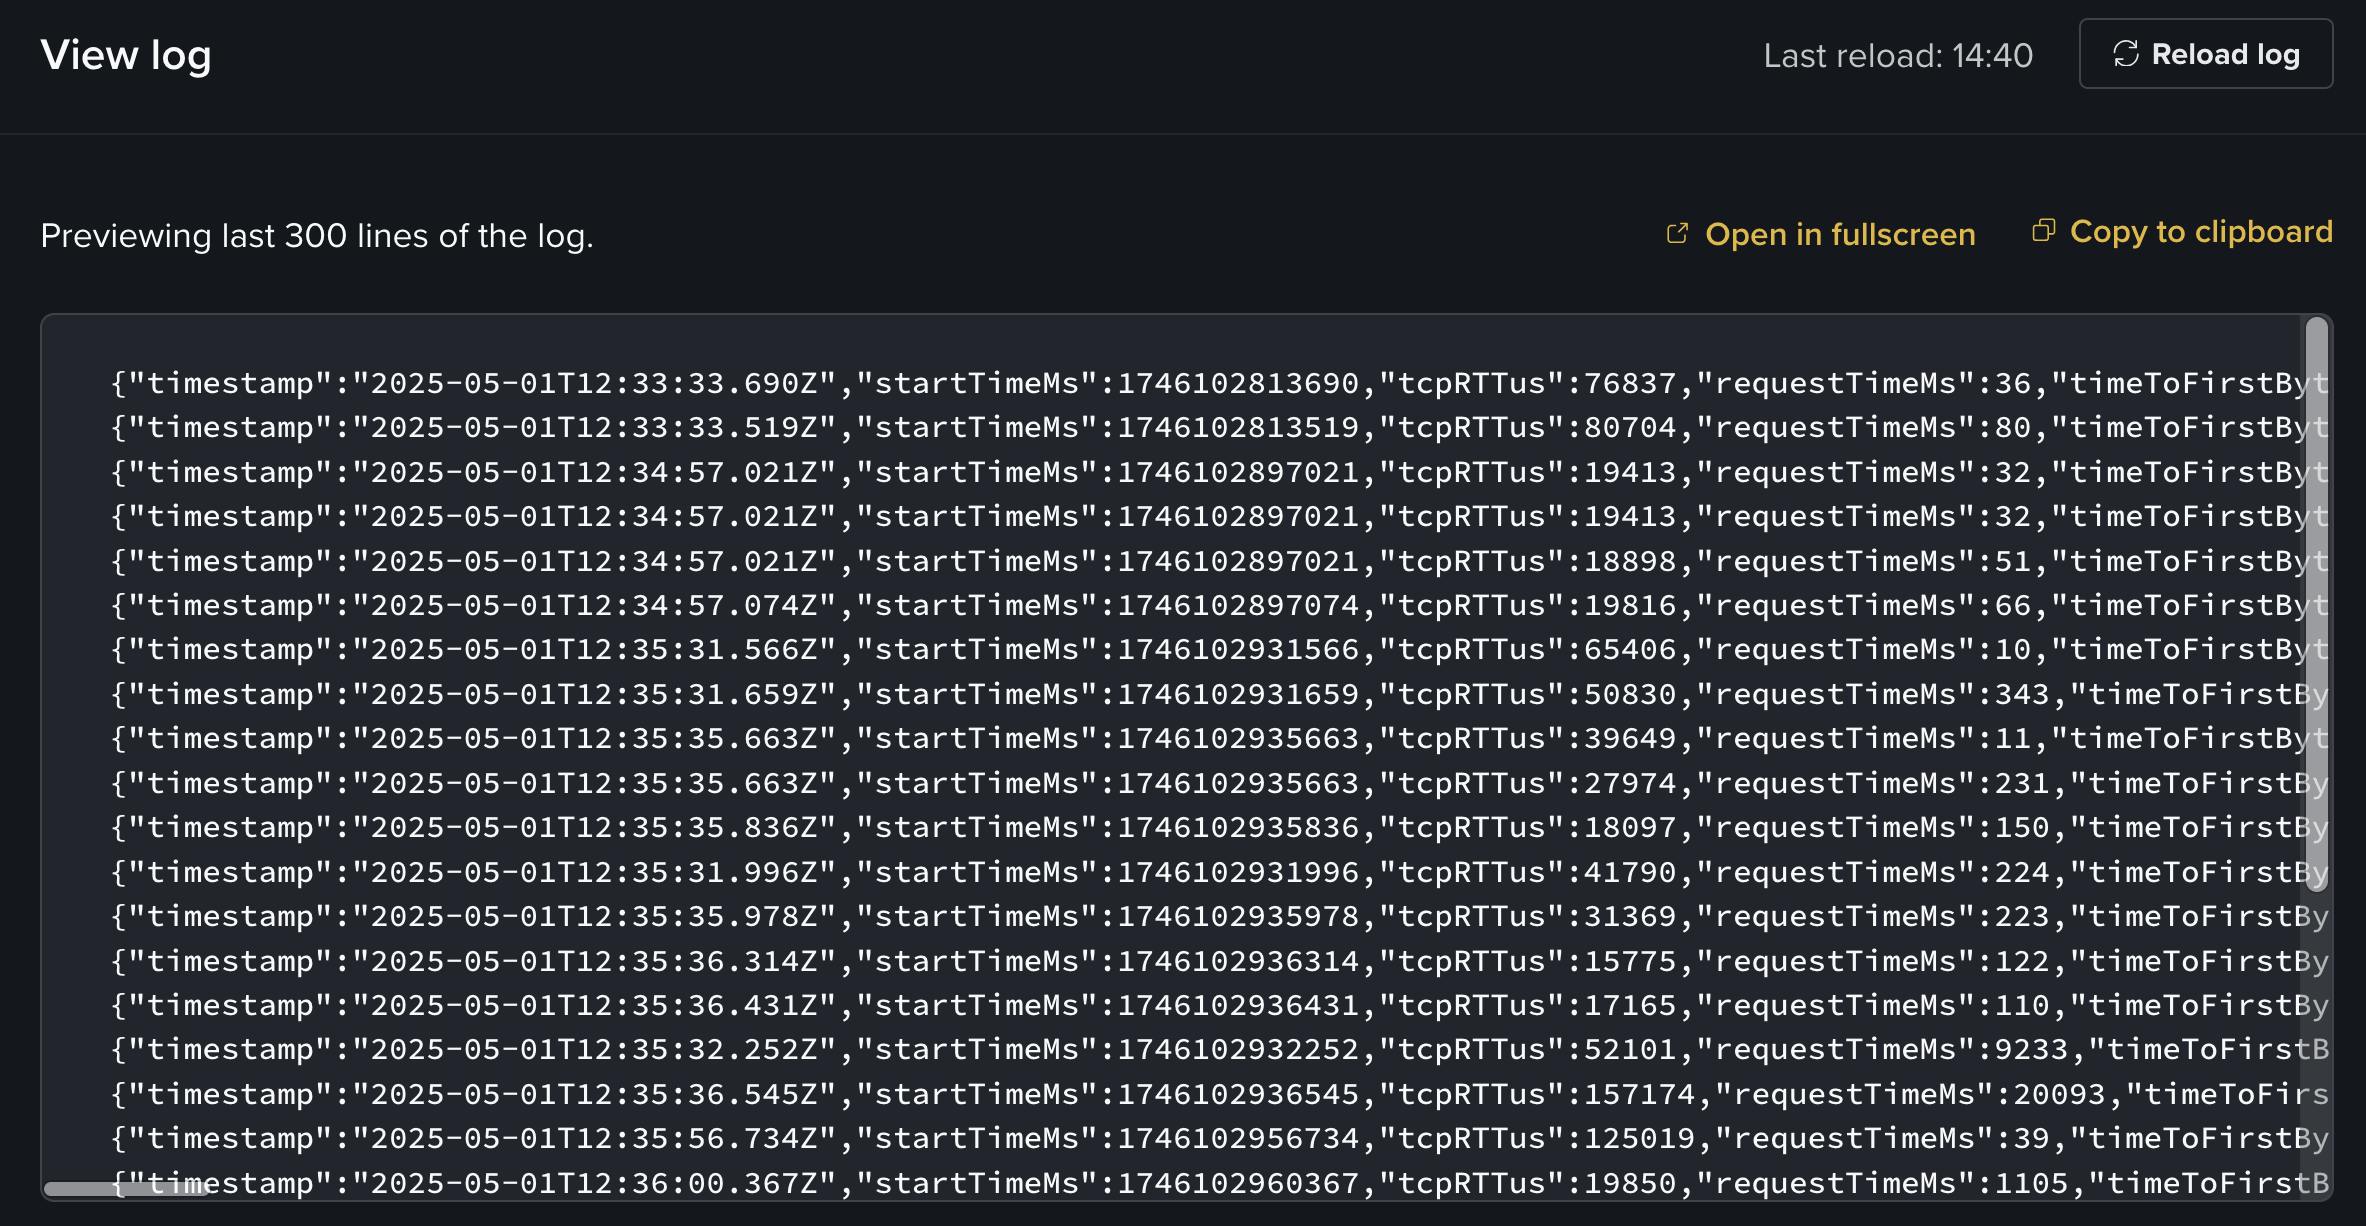
7. Shortly after completing the setup, the logs will start collecting. You can view the most recently logged request lines directly in the CDN77 Client Panel by opening the Real-Time Logs section, selecting the desired configuration, and clicking View log configuration.
This section shows the last 300 requests, or all requests from the last hour, depending on which limit is reached first.
8. Full logs are also batched and uploaded to the object storage as gzip files, allowing for deeper analysis.
Managing a Real-Time Logs configuration
You can manage an existing Real-Time Logs configuration from its configuration details in the CDN77 Client Panel.
From the configuration details, you can:
- review the selected logged fields,
- edit which fields are included in the log output,
- review applied filters,
- edit filters for the configuration,
- preview recently logged request lines.
Changes to logged fields or filters apply to the selected Real-Time Logs configuration.
Example of Real-Time Logs Data Set
This link details what data is capable of being logged, as well as example log lines of the different log formats. Further information may be available to be logged upon request.
Pricing
CDN77 Real-Time Logs are stored in the EU-1 cluster (HDD, located in Prague, Czech Republic).
- Real-Time Logs are stored on CDN77 Object Storage, standard CDN77 Object Storage pricing applies, and can be viewed here.
- Real-Time Logs start at $100/month per account. The monthly price includes 5 billion log requests, any requests above the 5 billion included will be billed at $0.02 per million log requests.
Updated on 26th October, 2026